What is a candlestick chart?
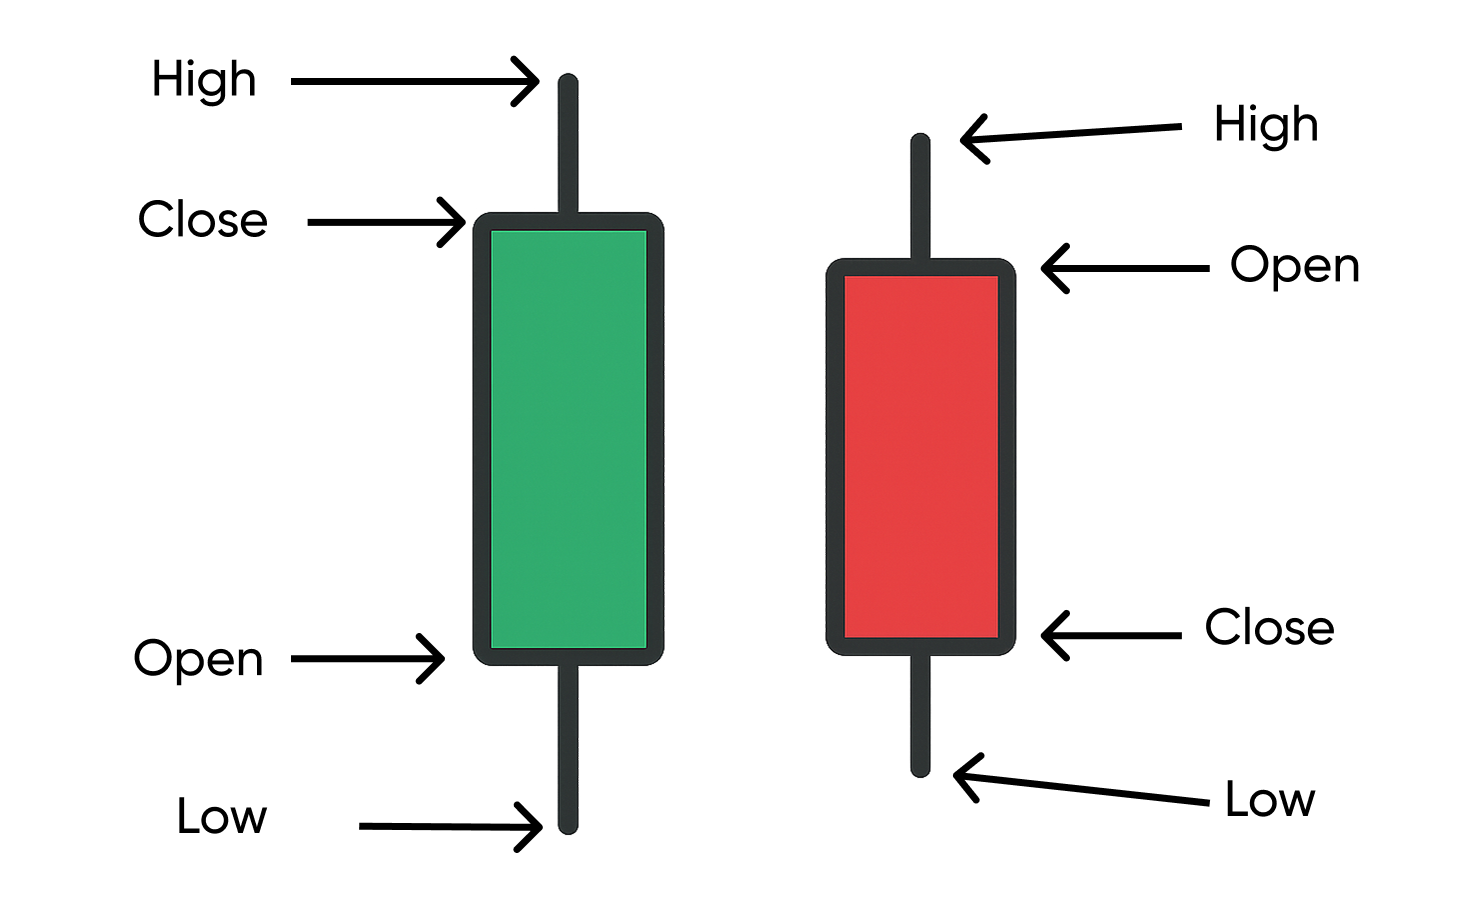
Candlestick charts show how the price moved during a time period, from the opening to the closing price, plus the high and the low in between. They are used in technical analysis to understand market behaviour and to spot possible trends.
Why candlesticks?
A candlestick gives more context than a simple line. It shows the opening price (Open), the closing price (Close), and how far price moved up (High) and down (Low) in that period. This helps you see buyer or seller patterns faster.
Structure of a candlestick
The body shows the range between open and close. Wicks (also called shadows) above and below mark the high and the low.
If price closes above the open, it is a rising candle (often coloured green). If it closes below the open, it is a falling candle (often coloured red).
Long bodies suggest strong trend pressure. Long wicks suggest rejection of a price level.
Timeframes
Candlesticks exist for minutes, hours, days, or weeks. Short timeframes create many signals, but also more “noise”. Longer timeframes are calmer and show the main trend. It is often useful to “zoom out”.
Common candlestick patterns
Candlesticks form repeatable patterns that may hint at buyer or seller dominance. Examples:
- Bullish signals: Hammer (long lower wick after selling), Bullish Engulfing (a large rising body covers the prior candle), Morning Star (three-candle reversal pattern).
- Bearish signals: Shooting Star (long upper wick after a rise), Bearish Engulfing, Evening Star (three-candle pattern that may mark a top). Important: patterns show historical tendencies, not guarantees. They are stronger when combined with trend, key price zones, and volume.
Limits and good practice
Candlesticks show psychology, not certainty. Single signals without context often mislead. Active trading and chart reading are harder than they look: you fight noise, false signals, fees, taxes, and your own emotions (FOMO, fear, overtrading). Patterns often work only with the trend, zones, and volume—and even then they can fail. Statistically, most retail traders underperform over time, often worse than simple buy-and-hold. For a calmer approach to Bitcoin, regular saving with DCA and self-custody is usually better than short-term trading.
Final Thoughts
- One candlestick shows Open, Close, High, and Low, more context than a line chart.
- Patterns can give hints, but they work best with trend, zones, and volume.
- Chart analysis and active trading are complex, many people lose money doing it.